Scalper's Fractal Cloud with RSI + VWAP + MACD (Fixed)Scalper’s Fractal Confluence Dashboard
1. Purpose of the Indicator
This TradingView indicator script provides a high-confluence setup for scalping and day trading. It blends momentum indicators (RSI, MACD), trend bias tools (EMA Cloud, VWAP), and structure (fractal swings, gap zones) to help confirm precise entries and exits.
2. Components of the Indicator
- EMA Cloud (50 & 200 EMA): Trend bias – green means bullish, red means bearish. Avoid longs under red cloud.
- VWAP: Institutional volume anchor. Ideal entries are pullbacks to VWAP in direction of trend.
- Gap Zones: Shows open-air zones (white space) where price can move fast. Used to anticipate momentum moves.
- ZigZag Swings: Marks structural pivots (highs/lows) – useful for stop placement and range anticipation.
- MACD Histogram: Shows bullish or bearish momentum via background color.
- RSI: Overbought (>70) or oversold (<30) warnings. Good for exits or countertrend reversion plays.
- EMA Spread Label: Quick view of momentum strength. Wide spread = strong trend.
3. Scalping Entry Checklist
Before entering a trade, confirm these conditions:
• • Bias: EMA cloud color supports trade direction
• • Price is above/below VWAP (confirming institutional flow)
• • MACD histogram matches direction (green for long, red for short)
• • RSI not at extreme (unless you’re fading trend)
• • If entering gap zone, expect fast move
• • Recent swing high/low nearby for target or stop
4. Risk & Sizing Guidelines
Risk 1–2% of account per trade. Place stop below recent swing low (for longs) or high (for shorts). Use fractional sizing near VWAP or white space zones for scalping reversals.
5. Daily Trade Journal Template
- Date:
- Ticker:
- Setup Type (VWAP pullback, Gap Break, EMA reversion):
- Entry Time:
- Bias (Green/Red Cloud):
- RSI Level / MACD Reading:
- Stop Loss:
- Target:
- Result (P/L):
- What I Did Well:
- What Needs Work:
"swing high"に関するスクリプトを検索

Swing Structure + Session Sweeps“Scalper-Friendly Trend & Sweep Detector”
Swing Structure + Session Sweeps with TEMA Cloud
This powerful all-in-one tool is designed for intraday traders, swing traders, and scalpers who want to spot high-probability reversals, trend continuations, and liquidity sweeps with confluence.
🔹 Core Features
Multi-layered TEMA Cloud (9, 20, 34, 50) for clear trend structure
Dynamic Bull/Bear labels when the trend flips
Centerline for TEMA 20 to visualize core trend direction
Session-based liquidity sweep detection (Asia, London, NY)
Volume and absorption dots to catch hidden pressure
Swing high/low detection (external and internal)
Visual VWAP, daily highs/lows, and customizable session zones
Optional alerts for volume spikes, absorption, and reversal sweeps
📈 Use it to:
Confirm directional bias
Anticipate pullbacks and breakouts
Identify volume-backed reversals
Align trades with session strength and swing confluence
⚙️ Built for scalpers, intraday opportunists, and precision chartists alike.

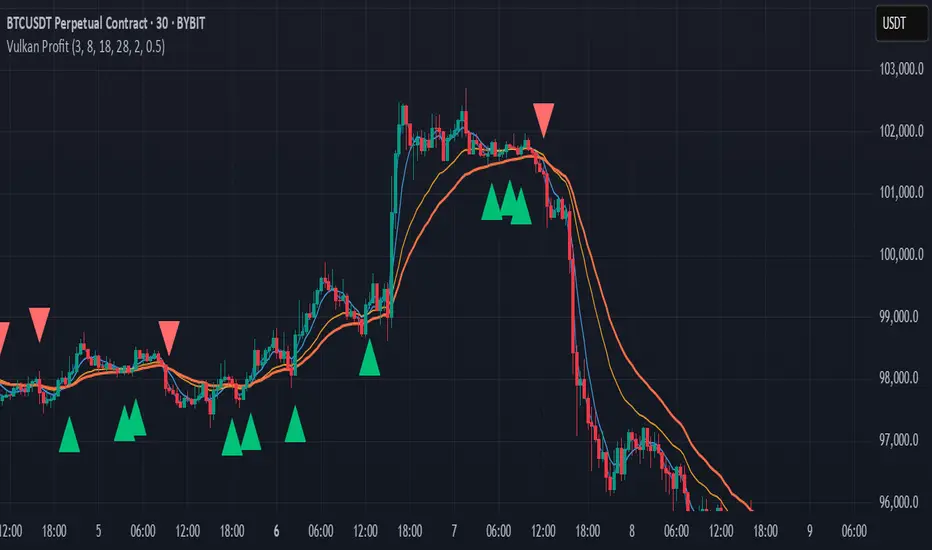
Vulkan Profit
Overview
The Vulkan Profit indicator is a trend-following tool that identifies potential entry and exit points by monitoring the relationship between short-term and long-term moving averages. It generates clear buy and sell signals when specific moving average conditions align, making it useful for traders looking to confirm trend changes across multiple timeframes.
How It Works
The indicator utilizes four different moving averages:
Fast WMA (period 3) - A highly responsive weighted moving average
Medium WMA (period 8) - A less sensitive weighted moving average
Fast EMA (period 18) - A responsive exponential moving average
Slow EMA (period 28) - A slower exponential moving average
These moving averages are grouped into two categories:
Short-term MAs: Fast WMA and Medium WMA
Long-term MAs: Fast EMA and Slow EMA
Signal Generation Logic
The Vulkan Profit indicator generates signals based on the relative positions of these moving averages:
Buy Signal (Green Triangle)
A buy signal appears when the minimum value of the short-term MAs becomes greater than the maximum value of the long-term MAs. In other words, when both short-term MAs cross above both long-term MAs.
Sell Signal (Red Triangle)
A sell signal appears when the maximum value of the short-term MAs becomes less than the minimum value of the long-term MAs. In other words, when both short-term MAs cross below both long-term MAs.
Visual Components
Moving Averages - All four moving averages can be displayed or hidden
Signal Arrows - Green triangles for buy signals, red triangles for sell signals
Colored Line - A line that changes color based on the current market stance (green for bullish, red for bearish)
Customization Options
The indicator offers several customization settings:
Toggle the visibility of moving averages
Toggle the visibility of buy/sell signals
Adjust the color, width, and position of the signal line
Choose between different line styles (Line, Stepline, Histogram)
Practical Trading Applications
Trend Identification: The relative positioning of all moving averages helps identify the current market trend
Entry/Exit Points: The buy and sell signals can be used as potential entry and exit points
Trend Confirmation: The colored line provides ongoing confirmation of the trend direction
Filter: Can be used in conjunction with other indicators as a trend filter
Trading Strategy Suggestions
Trend Following: Enter long positions on buy signals and exit on sell signals during trending markets
Confirmation Tool: Use the signals to confirm trades identified by other indicators
Timeframe Analysis: Apply the indicator across multiple timeframes for stronger confirmation
Risk Management: Place stop-loss orders below recent swing lows for long positions and above recent swing highs for short positions
Tips for Best Results
The indicator performs best in trending markets and may generate false signals in ranging or highly volatile markets
Consider the broader market context before taking trades based solely on these signals
Use appropriate position sizing and risk management regardless of the indicator's signals
The longer timeframes generally produce more reliable signals with fewer false positives
The Vulkan Profit indicator combines the responsiveness of short-term averages with the stability of long-term averages to capture significant trend changes while filtering out minor price fluctuations.
Supply & Demand Zones + Order Block (Pro Fusion) SuroLevel up your trading edge with this all-in-one Supply and Demand Zones + Order Block TradingView indicator, built for precision traders who focus on price action and smart money concepts.
🔍 Key Features:
Automatic detection of Supply & Demand Zones based on refined swing highs and lows
Dynamic Order Block recognition with customizable thresholds
Highlights Breakout signals with volume confirmation and trend filters
Built-in EMA 50 trend detection
Take Profit (TP1, TP2, TP3) projection levels
Clean visual labels for Demand, Supply, and OB zones
Uses smart box plotting with long extended zones for better zone visibility
🔥 Ideal for:
Traders who follow Smart Money Concepts (SMC)
Supply & Demand strategy practitioners
Breakout & Retest pattern traders
Scalpers, swing, and intraday traders using Order Flow logic
📈 Works on all markets: Forex, Crypto, Stocks, Indices
📊 Recommended timeframes: M15, H1, H4, Daily
✅ Enhance your trading strategy using this powerful zone-based script — bringing structure, clarity, and automation to your chart.
#SupplyAndDemand #OrderBlock #TradingViewScript #SmartMoney #BreakoutStrategy #TPProjection #ForexIndicator #SMC

IU Bigger than range strategyDESCRIPTION
IU Bigger Than Range Strategy is designed to capture breakout opportunities by identifying candles that are significantly larger than the previous range. It dynamically calculates the high and low of the last N candles and enters trades when the current candle's range exceeds the previous range. The strategy includes multiple stop-loss methods (Previous High/Low, ATR, Swing High/Low) and automatically manages take-profit and stop-loss levels based on user-defined risk-to-reward ratios. This versatile strategy is optimized for higher timeframes and assets like BTC but can be fine-tuned for different instruments and intervals.
USER INPUTS:
Look back Length: Number of candles to calculate the high-low range. Default is 22.
Risk to Reward: Sets the target reward relative to the stop-loss distance. Default is 3.
Stop Loss Method: Choose between:(Default is "Previous High/Low")
- Previous High/Low
- ATR (Average True Range)
- Swing High/Low
ATR Length: Defines the length for ATR calculation (only applicable when ATR is selected as the stop-loss method) (Default is 14).
ATR Factor: Multiplier applied to the ATR to determine stop-loss distance(Default is 2).
Swing High/Low Length: Specifies the length for identifying swing points (only applicable when Swing High/Low is selected as the stop-loss method).(Default is 2)
LONG CONDITION:
The current candle’s range (absolute difference between open and close) is greater than the previous range.
The closing price is higher than the opening price (bullish candle).
SHORT CONDITIONS:
The current candle’s range exceeds the previous range.
The closing price is lower than the opening price (bearish candle).
LONG EXIT:
Stop-loss:
- Previous Low
- ATR-based trailing stop
- Recent Swing Low
Take-profit:
- Defined by the Risk-to-Reward ratio (default 3x the stop-loss distance).
SHORT EXIT:
Stop-loss:
- Previous High
- ATR-based trailing stop
- Recent Swing High
Take-profit:
- Defined by the Risk-to-Reward ratio (default 3x the stop-loss distance).
ALERTS:
Long Entry Triggered
Short Entry Triggered
WHY IT IS UNIQUE:
This strategy dynamically adapts to different market conditions by identifying candles that exceed the previous range, ensuring that it only enters trades during strong breakout scenarios.
Multiple stop-loss methods provide flexibility for different trading styles and risk profiles.
The visual representation of stop-loss and take-profit levels with color-coded plots improves trade monitoring and decision-making.
HOW USERS CAN BENEFIT FROM IT:
Ideal for breakout traders looking to capitalize on momentum-driven price moves.
Provides flexibility to customize stop-loss methods and fine-tune risk management parameters.
Helps minimize drawdowns with a strong risk-to-reward framework while maximizing profit potential.

Gold Scalping BOS & CHoCHThis strategy is designed for scalping gold (XAU/USD) on the 3-minute timeframe, utilizing Break of Structure (BOS) and Change of Character (CHoCH) to identify high-probability trade setups. Unlike traditional SMA crossover strategies, this method focuses purely on price action and market structure shifts, allowing for early entries and better risk management.
Core Concepts:
Break of Structure (BOS) – Confirms a continuation of the trend when price breaks the last swing high (bullish) or last swing low (bearish).
Change of Character (CHoCH) – Detects possible trend reversals by identifying a shift in market momentum.
Dynamic Support & Resistance – Uses the last 10-bar highs and lows to determine adaptive stop-loss (SL) and take-profit (TP) levels.
Risk-to-Reward Ratio (1:2 RR) – Ensures trades are executed with a favorable risk/reward ratio.
Entry Conditions:
Buy Entry:
BOS (Bullish) confirmed (price breaks the previous swing high).
CHoCH (Bullish) confirms trend shift.
Price crosses back above the last swing low (confirmation of support).
Sell Entry:
BOS (Bearish) confirmed (price breaks the previous swing low).
CHoCH (Bearish) confirms trend shift.
Price crosses back below the last swing high (confirmation of resistance).
Exit Conditions:
Stop Loss (SL): Set at the most recent dynamic support (for buys) or resistance (for sells).
Take Profit (TP): 2x the risk (1:2 risk-reward ratio).
Advantages of This Strategy:
✅ No lagging indicators – Uses price action for real-time entries.
✅ High probability setups – Focuses only on strong structural breaks.
✅ Adaptive SL/TP – Uses real market structure instead of fixed values.
✅ Optimized for Scalping – Best suited for quick in-and-out trades.
Best Time to Trade:
🔹 London & New York Sessions (High volatility for gold).

Volume-Price Divergence RSIUnderstanding the Display
Once added, you'll see a new panel below your price chart with:
Purple Line: This is the RSI (Relative Strength Index)
Red Dashed Line: The overbought threshold (default: 70)
Green Dashed Line: The oversold threshold (default: 30)
Blue Columns: Volume histogram
Dark Blue Line: Volume moving average
Trading Signals
Look for these markers on the indicator panel:
Green Triangle (↑): Buy signal - appears when there's a bullish divergence AND RSI conditions are met (oversold and rising)
Red Triangle (↓): Sell signal - appears when there's a bearish divergence AND RSI conditions are met (overbought and falling)
Lime Diamond (◆): Bullish divergence without RSI confirmation
Orange Diamond (◆): Bearish divergence without RSI confirmation
What These Signals Mean
Buy Signal (Green Triangle):
Price is making lower lows BUT volume is making higher lows
RSI is in oversold territory (below 30) and starting to rise
This suggests potential upward reversal
Sell Signal (Red Triangle):
Price is making higher highs BUT volume is making lower highs
RSI is in overbought territory (above 70) and starting to fall
This suggests potential downward reversal
Customizing the Indicator
To adjust settings:
Right-click on the indicator
Select "Settings"
In the "Inputs" tab, you can modify:
RSI Period (default: 14)
Volume MA Period (default: 20)
Lookback Period for finding pivot points (default: 10)
RSI Overbought level (default: 70)
RSI Oversold level (default: 30)
Setting Alerts
To get notified when a signal appears:
Right-click on the indicator
Select "Add Alert"
Choose the condition you want to be alerted for:
Buy Signal
Sell Signal
Bullish Divergence
Bearish Divergence
Configure notification preferences and save
Trading Strategy
This indicator is best used:
On higher timeframes (4H, Daily) for more reliable signals
As confirmation with other indicators or price action
At market extremes where divergences are more meaningful
With proper risk management (stop losses below recent swing lows for buys, above recent swing highs for sells)
Remember that no indicator is 100% accurate. This tool works by identifying situations where price movement isn't confirmed by volume, suggesting a potential reversal, especially when RSI conditions align.
Valerio Diotallevi

Adaptive Fibonacci Volatility Bands (AFVB)
**Adaptive Fibonacci Volatility Bands (AFVB)**
### **Overview**
The **Adaptive Fibonacci Volatility Bands (AFVB)** indicator enhances standard **Fibonacci retracement levels** by dynamically adjusting them based on market **volatility**. By incorporating **ATR (Average True Range) adjustments**, this indicator refines key **support and resistance zones**, helping traders identify **more reliable entry and exit points**.
**Key Features:**
- **ATR-based adaptive Fibonacci levels** that adjust to changing market volatility.
- **Buy and Sell signals** based on price interactions with dynamic support/resistance.
- **Toggleable confirmation filter** for refining trade signals.
- **Customizable color schemes** and alerts.
---
## **How This Indicator Works**
The **AFVB** operates in three main steps:
### **1️⃣ Detecting Key Fibonacci Levels**
The script calculates **swing highs and swing lows** using a user-defined lookback period. From this, it derives **Fibonacci retracement levels**:
- **0% (High)**
- **23.6%**
- **38.2%**
- **50% (Mid-Level)**
- **61.8%**
- **78.6%**
- **100% (Low)**
### **2️⃣ Adjusting for Market Volatility**
Instead of using **fixed retracement levels**, this indicator incorporates an **ATR-based adjustment**:
- **Resistance levels** shift **upward** based on ATR.
- **Support levels** shift **downward** based on ATR.
- This makes levels more **responsive** to price action.
### **3️⃣ Generating Buy & Sell Signals**
AFVB provides **two types of signals** based on price interactions with key levels:
✔ **Buy Signal**:
Occurs when price **dips below** a support level (78.6% or 100%) and **then closes back above it**.
- **Optionally**, a confirmation buffer can be enabled to require price to close **above an additional threshold** (based on ATR).
✔ **Sell Signal**:
Triggered when price **breaks above a resistance level** (0% or 23.6%) and **then closes below it**.
📌 **Important:**
- The **buy threshold setting** allows traders to **fine-tune** entry conditions.
- Turning this setting **off** generates **more frequent** buy signals.
- Keeping it **on** reduces false signals but may result in **fewer trade opportunities**.
---
## **How to Use This Indicator in Trading**
### 🔹 **Entry Strategy (Buying)**
1️⃣ Look for **buy signals** at the **78.6% or 100% Fibonacci levels**.
2️⃣ Ensure price **closes above** the support level before entering a long trade.
3️⃣ **Enable or disable** the buy threshold filter depending on desired trade strictness.
### 🔹 **Exit Strategy (Selling)**
1️⃣ Watch for **sell signals** at the **0% or 23.6% Fibonacci levels**.
2️⃣ If price **breaks above resistance and then closes below**, consider exiting long positions.
3️⃣ Can be used **alone** or **combined with trend confirmation tools** (e.g., moving averages, RSI).
### 🔹 **Using the Toggleable Buy Threshold**
- **ON**: Buy signal requires **extra confirmation** (reduces false signals but fewer trades).
- **OFF**: Buy triggers as soon as price **closes back above support** (more signals, but may include weaker setups).
---
## **User Inputs**
### **🔧 Customization Options**
- **ATR Length**: Defines the period for **ATR calculation**.
- **Swing Lookback**: Determines how far back to find **swing highs and lows**.
- **ATR Multiplier**: Adjusts the size of **volatility-based modifications**.
- **Buy/Sell Threshold Factor**: Fine-tunes the **entry signal strictness**.
- **Show Level Labels**: Enables/disables **Fibonacci level annotations**.
- **Color Settings**: Customize **support/resistance colors**.
### **📢 Alerts**
AFVB includes built-in **alert conditions** for:
- **Buy Signals** ("AFVB BUY SIGNAL - Possible reversal at support")
- **Sell Signals** ("AFVB SELL SIGNAL - Possible reversal at resistance")
- **Any Signal Triggered** (Useful for automated alerts)
---
## **Who Is This Indicator For?**
✅ **Scalpers & Day Traders** – Helps identify **short-term reversals**.
✅ **Swing Traders** – Useful for **buying dips** and **selling rallies**.
✅ **Trend Traders** – Can be combined with **momentum indicators** for confirmation.
**Best Timeframes:**
⏳ **15-minute, 1-hour, 4-hour, Daily charts** (works across multiple assets).
---
## **Limitations & Considerations**
🚨 **Important Notes**:
- **No indicator guarantees profits**. Always **combine** it with **risk management strategies**.
- Works best **in trending & mean-reverting markets**—may generate false signals in **choppy conditions**.
- Performance may vary across **different assets & timeframes**.
📢 **Backtesting is recommended** before using it for live trading.

Intraday Anchored FanSimilar to an Anchored VWAP, this lets you click a bar on an Intraday chart to add an "Anchored Fan" which displays lines at up to 6 levels above and below the chosen Anchor Point. Useful to measure the retracement during swing moves.
You can reposition the fan by either hovering over the anchor or by clicking the name of the study to "activate" it, and then dragging. You can also change the Anchor Point in Settings.
By default the anchor uses the bar Close, but you can change this manually in settings OR you can use the fancy "Auto high/low" mode which is handy if you are mainly dropping the fan on local swing highs and lows.
The default line measures were chosen for ES (Futures) but the study should be usable with nearly anything as long as you adjust the settings to something appropriate for the ticker. If you want to use this on NQ, for example, it would be reasonable to multiple each of these settings by 3.5 or so.
NOTE: If the fan is off the left side of the chart, one way to see the Anchor handle again easily is to switch to a higher timeframe; for example if you are on the 5min maybe use the 15min or hourly to find the handle -- if it is WAY off the left side (for example if you let many days pass without advancing it) it's generally easiest to use Settings to move it back to "now".

VWAP Horizon Suite Optimized - CoffeeKillerVWAP Horizon Suite Optimized - User Guide
Overview
The VWAP Horizon Suite Optimized is a comprehensive technical analysis tool for TradingView designed to enhance your trading strategy with Volume Weighted Average Price (VWAP) analysis, standard deviation bands, and customizable Exponential Moving Averages (EMAs). This indicator provides a robust framework for identifying potential support and resistance levels, price momentum, and market trends.
Key Features
- **Daily VWAP with Session Reset**: Automatically resets at 17:00 (5:00 PM) each day
- **Customizable Standard Deviation/Percentage Bands**: Up to 3 bands above and below VWAP
- **High/Low Point Detection**: Visual markers for significant price levels
- **Multiple Customizable EMAs**: 8 different EMAs that can be individually toggled and styled
- **Visual Customization**: Adjustable colors, fills, and styles for all elements
VWAP Settings
- **Source**: Determines the price data used to calculate VWAP (default: HLC3 - High, Low, Close average)
Bands Settings
- **Bands Calculation Mode**: Choose between "Standard Deviation" or "Percentage" methods
- **Show Band #1, #2, #3**: Toggle visibility for each band
- **Band Multiplier #1, #2, #3**: Adjust the distance from VWAP (in standard deviations or percentage)
- **Show Fills**: Enable colored fills between bands for better visualization
Visualization Settings
- **Show High/Low Markers**: Display diamond markers for local high and low points relative to VWAP, these reset based on the price crossing the VWAP Line.
EMA Settings
The indicator provides 8 customizable EMAs (8, 13, 21, 26, 48, 50, 100, and 200) with individual controls:
- **Show EMA X**: Toggle visibility for each EMA
- **EMA X Period**: Adjust the period length for calculation
- **EMA X Color**: Customize the color of each EMA
- **EMA Line Width**: Set the width for all EMA lines
How to Use
Basic VWAP Analysis
The core VWAP line (blue) represents the average price weighted by volume since the start of the session (17:00 daily reset). This serves as a dynamic support/resistance level and reference point for intraday trading.
1. **Price above VWAP**: Generally bullish short-term sentiment
2. **Price below VWAP**: Generally bearish short-term sentiment
3. **Crosses of VWAP**: Potential shift in short-term momentum
Standard Deviation Bands
The bands surrounding VWAP help identify potential support, resistance, and volatility levels:
- **Band #1 (±1σ)**: Price often reverts to VWAP when reaching these levels
- **Band #2 (±2σ)**: Stronger support/resistance areas, possible reversal zones
- **Band #3 (±3σ)**: Extreme price levels, often indicating overbought/oversold conditions
High/Low Point Detection
Purple and yellow diamond markers identify significant swing highs and lows relative to VWAP, helping you recognize potential reversal points or continuation patterns. (These repaint in a effort to find the max high/low point from the VWAP Line)
EMA Strategy
The customizable EMAs can be used to:
- Find potential support/resistance levels
- Create crossover systems
- Analyze market structure
Common EMA combinations include:
- 8 & 21 for short-term trends
- 50 & 200 for long-term trends and the "Golden Cross/Death Cross"
- 13 & 48 for the "New Golden Cross" - a modern alternative gaining popularity among traders
- 8, 13, 21 for complex short-term momentum analysis
Advanced Usage Tips
For Day Traders
1. **Opening Range Analysis**: Watch how price reacts to VWAP in the first hour of trading
2. **VWAP Reversions**: Look for trades when price touches outer bands and reverses toward VWAP
3. **Band Breakouts**: Strong moves beyond Band #2 may indicate momentum for continuation
For Swing Traders
1. **Use alongside daily/weekly support-resistance levels**
2. **Combine with EMA crossovers for trend confirmation**
3. **Identify potential reversal zones where price reaches Band #3**
Combined Strategies
- **EMA + VWAP Confluence**: Strong signals occur when EMA lines and VWAP/bands align at the same price level
- **High/Low + Band Touch**: When a high/low marker appears near a band, it may indicate a stronger support/resistance level
Conclusion
The VWAP Horizon Suite Optimized provides a comprehensive set of tools for price analysis based on volume-weighted data and exponential averages. By understanding and properly configuring the various components, you can create a powerful visual framework for identifying potential trading opportunities across multiple timeframes.
Remember that no indicator provides perfect signals, and the VWAP Horizon Suite works best when used as part of a complete trading strategy that includes risk management, multiple confirmation tools, and proper analysis of market conditions.
DISCLAIMER
**DISCLAIMER: This indicator and its signals are intended solely for educational and informational purposes. They do not constitute financial advice. Trading involves significant risk of loss. Always conduct your own analysis and consult with financial professionals before making trading decisions.**

Enhanced BarUpDn StrategyEnhanced BarUpDn Strategy
The Enhanced BarUpDn Strategy is a refined price action-based trading approach that identifies market trends and reversals using bar formations. It focuses on detecting bullish and bearish momentum by analyzing consecutive price bars and key support/resistance levels.
Key Features:
✅ Trend Confirmation – Uses a combination of bar patterns and indicators (e.g., moving averages, RSI) to confirm momentum shifts.
✅ Entry Signals – A buy signal is triggered when an "Up Bar" (higher high, higher low) follows a bullish setup; a sell signal when a "Down Bar" (lower high, lower low) confirms bearish momentum.
✅ Enhanced Filters – Incorporates volume analysis and additional conditions to reduce false signals.
✅ Stop-Loss & Risk Management – Uses recent swing highs/lows for stop placement and dynamic trailing stops for maximizing gains.

Trend Vanguard StrategyHow to Use:
Trend Vanguard Strategy is a multi-feature Pine Script strategy designed to identify market pivots, draw dynamic support/resistance, and generate trade signals via ZigZag breakouts. Here’s how it works and how to use it:
ZigZag Detection & Pivot Points
The script locates significant swing highs and lows using configurable Depth, Deviation, and Backstep values.
It then connects these pivots with lines (ZigZag) to highlight directional changes and prints labels (“Buy,” “Sell,” etc.) at key turning points.
Support & Resistance Trendlines
Pivot highs and lows are used to draw dashed S/R lines in real-time.
When price crosses these lines, the script triggers a breakout signal (long or short).
EMA Overlays
Up to four EMAs (with customizable lengths and colors) can be overlaid on the chart for added trend confirmation.
Enable/disable each EMA independently via the settings.
Repaint Option
Turning on “Smooth Indicator Lines” (repaint) uses future data to refine past pivots.
This can make historical signals look cleaner but does not reflect true historical conditions.
Turning it off ensures signals remain fixed once they appear.
Strategy Entries & Exits
On each new ZigZag “Buy” or “Sell” signal, the script closes any open position and flips to the opposite side (if desired).
Works with the built-in TradingView Strategy engine for backtesting.
Additional Inputs (Placeholders)
Volume Filter and RSI Filter settings exist but are not fully implemented in the current code. Future versions may incorporate these filters more directly.
How to Use
Add to Chart: Click “Indicators” → “Invite-Only Scripts” (or “My Scripts”) and select “Trend Vanguard Strategy.”
Configure Settings:
Adjust ZigZag Depth, Deviation, and Backstep to fine-tune pivot sensitivity.
Enable or disable each EMA to see how it aligns with market trends.
Toggle “Smooth Indicator Lines” on or off depending on whether you want repainting.
Backtest and Forward Test:
Use TradingView’s “Strategy Tester” tab to review hypothetical performance.
Remember that repainting can alter past signals if enabled.
Monitor Live:
Watch for breakout triangles or ZigZag labels to identify potential reversal or breakout trades in real time.
Disclaimer: This script is purely educational and not financial advice. Always combine it with sound risk management and thorough analysis. Enjoy exploring the script, and feel free to experiment with the different settings to match your trading style!

Trending Market Toolkit [LuxAlgo]The Trending Market Toolkit focuses exclusively on trending market structures and high-confluence, high-risk-to-reward entry models. It is designed to complement discretionary trading by offering different entry strategies based on market structure.
🔶 USAGE
In the chart above we can see how the tool detects several reversals, draws the broken trendlines, the reversal areas from which the tool starts looking for a trigger, and when it finally happens, a potential trade with risk and reward areas and the risk/reward ratio.
🔹 Detection Mode
Traders can choose between three different modes: trend only, reversal only, or both.
If both are active, reversals have priority over trends, so the tool will not detect a trend if a reversal is active.
In the chart above we can see all three modes.
🔹 Detection on Higher Timeframes
Traders can choose to identify structures on the chart timeframe or on a higher timeframe.
In the chart above, we have the SP500 futures on the 5m timeframe with different settings: chart timeframe, 30m, and 1H.
🔹 Risk And Targets
Depending on whether the high-risk/reward parameter is enabled, traders can choose between three different targets and two different stops.
The chart above shows how different choices affect the risk/reward ratio for the same potential trade on the Gold Futures 2m chart.
🔶 SETTINGS
Show: Traders can choose between Trends, Reversals or Both.
🔹 Structures
Swing Length: Number of candles to confirm a swing high or swing low. A higher number detects larger swings.
Custom Timeframe: Traders can make use of the current chart timeframe, or choose a custom timeframe.
Reversal Area Threshold: A higher number increases the reversal area.
🔹 Trades
Trade Trigger Length: Number of candles to confirm an internal high or internal low. A lower number detects smaller swings. It must be the same size or smaller than the swing length.
Target: Traders can choose between the default target (0) or two extended targets (0.27 or 0.618).
Risk to Reward Threshold: Set the minimum risk-to-reward ratio to detect trades. Use the 0 value to detect all trades.
High Risk to Reward: Enable/Disable the high risk to reward mode.

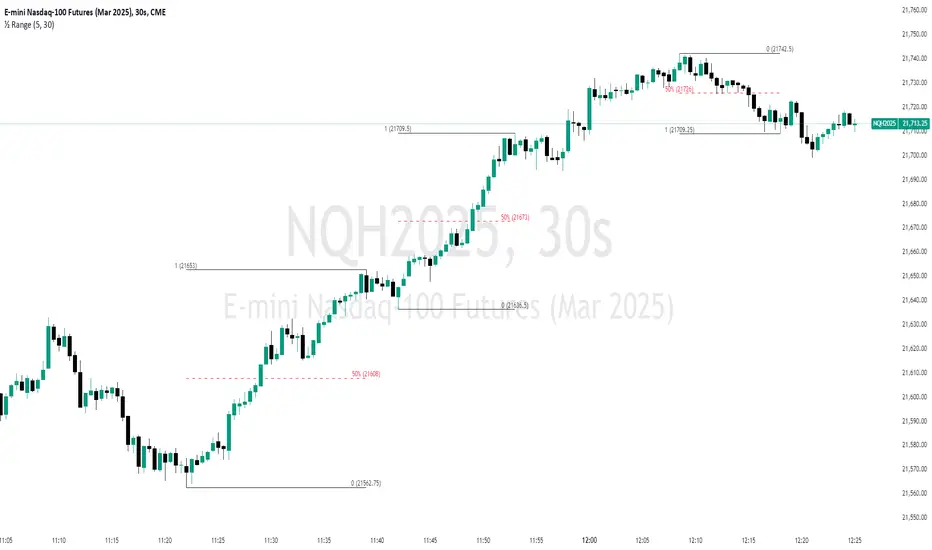
Unmitigated 50% of the RangeThis indicator is designed to display unmitigated 50% zones of price ranges within two swing (High and Low) points. The 50% level serves as a probable target for retracements before the price resumes its movement in the direction of the most recent swing. The underlying theory is that Price Action tends to correct unbalanced price zones by returning to 50% of the range.
The indicator identifies highs and lows utilizing the “Left Swing Sensitivity” setting, which detects the high/low points within the specified number of bars. It then ensures that the zone meets a minimum size requirement, configured via the “Minimum Leg Size” setting, to filter out smaller legs/zones that would not provide sufficient profit and loss opportunities for entries at 50% and take profit at the most recent swing point.
To prevent duplication of zones when the price is gradually moving up, an "Auto Adjust Levels" setting is available. Enabled by default, this feature automatically cleans up smaller zones, retaining only the primary zone between the most recent swing point and the outer swing.
Additionally, the indicator automatically removes mitigated zones where the price has returned to the 50% level, thus maintaining clean charts.
There are several visualization settings available, offering comprehensive control over what is displayed on the charts:
Control the color and style of the lines representing the 1, 0, and 50% levels.
Choose whether to display labels and if they should show the price at the rendered levels.
Optionally extend the lines/labels to the right for each level.
Auto Fibonacci Extension and Retracement with Visual AlertsThis indicator automatically calculates and plots Fibonacci retracement and extension levels based on recent swing highs and lows, making it a powerful tool for traders who use Fibonacci analysis in their strategies.
Key Features:
• Dynamic Fibonacci Levels: Automatically detects swing highs and lows over a user-defined lookback period to calculate key Fibonacci retracement (e.g., 0.236, 0.382, 0.618, etc.) and extension (e.g., 1.618, 2.618, etc.) levels.
• Visual Alerts: Displays intuitive visual alerts when the price crosses important Fibonacci levels.
• Blue dashed lines for retracement levels.
• Green dashed lines for extension levels.
• Labels with up or down arrows indicating price interactions with these levels.
• Swing High/Low Visualization: Marks recent swing highs and lows with crosses for better clarity.
• Customizable: Adjust the lookback period and Fibonacci levels to suit your trading style.
Who is it for?
This indicator is perfect for:
• Swing Traders: To identify potential reversal or continuation zones.
• Day Traders: For short-term setups based on Fibonacci levels.
• Fibonacci Enthusiasts: To automate the time-consuming process of manually plotting levels.
Usage Ideas:
1. Use retracement levels (e.g., 0.618) to identify areas of potential support or resistance.
2. Use extension levels (e.g., 1.618) to target potential breakout or continuation zones.
3. Combine this indicator with candlestick patterns, volume analysis, or other tools for confirmation.
Limitations:
• This is a standalone indicator and does not provide buy/sell signals. It’s recommended to combine it with other technical analysis tools for best results.
• The lookback period and swing detection rely on past data, so adjustments may be needed based on the asset or timeframe.
Whether you’re looking to streamline your Fibonacci analysis or explore new opportunities in your trading, this indicator is designed to save time, increase accuracy, and enhance your overall trading experience.

Detrended Price Oscillator [NexusSignals]Detrended Price Oscillator (DPO) is a detrended price oscillator, used in technical analysis, strips out price trends in an effort to estimate the length of price cycles from peak to peak or trough to trough.
DPO is not a momentum indicator, instead highlights peaks and troughs in price, which are used to estimate buy and sell points in line with the historical cycle. (cf. to investopedia)
DPO indicator made by NexusSignals components :
a filled area that allow users to see easy the trend of an asset;
a sma moving average on chart (default length is 20)
a 20 sma on oscillator, both ma's are color coded to show uptrend / downtrend
a donchian channel applied to the dpo to show breakouts, breakdowns and resistances/support, reversals
few alerts for price crossing above ma, cross above the 0 dpo line, and for cross above and below the donchian channels top and bottom
How you can use DPO indicator ?
The detrended price oscillator (DPO) can be used for measuring the distance between peaks and troughs in the indicator that may help traders to make future decisions as they can locate the most recent trough and determine when the next one may occur in the meassured distance on oscillator between peaks and troughs.
You can use the indicator to find the potential price reversals, for example when the price of an asset is in a bearish trend and the dpo is bouncing from the donchian channel bottom, that may be a potential swing low for that asset, same thing in a bullish trend when the dpo rejecting at top of donchian channel may be a trend reversal, a pullback or swing high.
When DPO is above the 0 trend is in an uptrend and when dpo is below the zero the asset is possible to move into a downtrend.
Also crosses of DPO above and below the DPO moving average may signalising a trend change.

ATT Model with Buy/Sell SignalsIndicator Summary
This indicator is based on the ATT (Arithmetic Time Theory) model, using specific turning points derived from the ATT sequence (3, 11, 17, 29, 41, 47, 53, 59) to identify potential market reversals. It also integrates the RSI (Relative Strength Index) to confirm overbought and oversold conditions, triggering buy and sell signals when conditions align with the ATT sequence and RSI level.
Turning Points: Detected based on the ATT sequence applied to bar count. This suggests high-probability areas where the market could turn.
RSI Filter: Adds strength to the signals by ensuring buy signals occur when RSI is oversold (<30) and sell signals when RSI is overbought (>70).
Max Signals Per Session: Limits signals to two per session to reduce over-trading.
Entry Criteria
Buy Signal: Enter a buy trade if:
The indicator displays a green "BUY" marker.
RSI is below the oversold level (default <30), suggesting a potential upward reversal.
Sell Signal: Enter a sell trade if:
The indicator displays a red "SELL" marker.
RSI is above the overbought level (default >70), indicating a potential downward reversal.
Exit Criteria
Take Profit (TP):
Define TP as a fixed percentage or point value based on the asset's volatility. For example, set TP at 1.5-2x the risk, or a predefined point target (like 50-100 points).
Alternatively, exit the position when price approaches a key support/resistance level or the next significant swing high/low.
Stop Loss (SL):
Place the SL below the recent low (for buys) or above the recent high (for sells).
Set a fixed SL in points or percentage based on the asset’s average movement range, like an ATR-based stop, or limit it to a specific risk amount per trade (1-2% of account).
Trailing into Profit
Use a trailing strategy to lock in profits and let winning trades run further. Two main options:
ATR Trailing Stop:
Set the trailing stop based on the ATR (Average True Range), adjusting every time a new candle closes. This can help in volatile markets by keeping the stop at a consistent distance based on recent price movement.
Break-Even and Partial Profits:
When the price moves in your favor by a set amount (e.g., 1:1 risk/reward), move SL to the entry (break-even).
Take partial profit at intermediate levels (e.g., 50% at 1:1 RR) and trail the remainder.
Risk Management for Prop Firm Evaluation
Prop firms often have strict rules on daily loss limits, max drawdowns, and minimum profit targets. Here’s how to align your strategy with these:
Limit Risk per Trade:
Keep risk per trade to a conservative level (e.g., 1% or lower of your account balance). This allows for more room in case of a drawdown and aligns with most prop firm requirements.
Daily Loss Limits:
Set a daily stop-loss that ensures you don’t exceed the firm’s rules. For example, if the daily limit is 5%, stop trading once you reach a 3-4% drawdown.
Avoid Over-Trading:
Stick to the max signals per session rule (one or two trades). Taking only high-probability setups reduces emotional and reactive trades, preserving capital.
Stick to a Profit Target:
Aim to meet the evaluation’s profit goal efficiently but avoid risky or oversized trades to reach it faster.
Avoid Major Economic Events:
News events can disrupt technical setups. Avoid trading around significant releases (like FOMC or NFP) to reduce the chance of sudden losses due to high volatility.
Summary
Using this strategy with discipline, a structured entry/exit approach, and tight risk management can maximize your chances of passing a prop firm evaluation. The ATT model’s turning points, combined with the RSI, provide an edge by highlighting reversal zones, while limiting trades to 1-2 per session helps maintain controlled risk.

Adaptive Support & Resistance Zones Description:
The Enhanced Support and Resistance Zones indicator identifies and visualizes significant support and resistance areas on the chart, helping traders spot potential reversal or breakout points. This tool offers advanced customization options for zone thickness, lookback period, validation criteria, and zone expiration, making it adaptable for various trading styles and market conditions.
Key Features:
1. Zone Thickness Multiplier: The Zone Thickness Multiplier controls the visual “thickness” of each support and resistance zone, allowing traders to adjust the width based on volatility or personal preference. A higher multiplier increases the zone’s range, capturing a wider area around the support or resistance level.
2. Lookback Periods for Support and Resistance: The Lookback for Resistance and Lookback for Support inputs define the number of bars analyzed to identify swing highs and lows, respectively. This allows traders to adjust how far back the script should search for key levels, which can be useful when adjusting for different timeframes or varying levels of historical significance in zones.
3. Minimum Touch Count: To filter out weak zones, the Minimum Touch Count setting establishes the required number of price “touches” (or tests) within a zone before it’s considered valid. By increasing this value, traders can focus only on zones that the price has interacted with frequently, indicating stronger potential support or resistance.
4. Zone Expiration Bars: The Zone Expiration Bars setting enables automatic expiration of older zones, reducing chart clutter from outdated levels. This parameter specifies the maximum number of bars a zone will remain active after its creation. When the set limit is reached, the zone is cleared, allowing the indicator to stay responsive to more recent price action.
5. Dynamic Visualization by Touch Count: Zones with more touches are displayed with a thicker line, visually emphasizing the strength of these areas. Zones with fewer touches are shown with a thinner line, helping traders easily distinguish between stronger and weaker support and resistance levels.
6. Alerts for Zone Touches: Alerts can be configured to notify traders when the price touches the support or resistance zones, offering real-time notifications for potential trading opportunities.
How to Use:
1. Adjusting Zone Thickness: Use the Zone Thickness Multiplier to expand or contract the width of each zone. A higher multiplier may be beneficial in volatile markets, where price tends to fluctuate around levels rather than touching them precisely. Lower values can provide a more precise zone in less volatile environments.
2. Setting Lookback Periods for Zone Identification: The Lookback for Resistance and Lookback for Support inputs allow traders to define how many historical bars to analyze for determining key levels. Longer lookbacks may be useful on higher timeframes to capture more significant support or resistance, while shorter lookbacks can be suitable for lower timeframes or more recent levels.
3. Filtering with Minimum Touch Count: Increase the Minimum Touch Count to filter for stronger zones. For example, setting a minimum touch count of 3 will display only zones that have been tested by the price at least three times, indicating potentially stronger support or resistance.
4. Configuring Zone Expiration: Use Zone Expiration Bars to limit how long each zone remains on the chart, helping to keep the focus on more recent levels. Expiring zones after a set number of bars can be especially useful on lower timeframes, where older levels may no longer be relevant.
5. Using Alerts for Real-Time Notifications: Set up alerts to receive notifications when price enters the support or resistance zones, allowing you to monitor potential trade setups without needing to watch the chart continuously.
This indicator is well-suited for traders aiming to identify high-quality support and resistance areas while managing chart clarity. With these customizable options, traders can adapt the indicator to match their unique trading style and market focus. For best results, test these settings on your preferred timeframe and adjust parameters to fit specific trading goals and market conditions.

Swing Breakout Sequence [LuxAlgo]The Swing Breakout Sequence tool enables traders to identify a directional price action scalping sequence comprising two unsuccessful breakouts in the same direction, with the expectation of a third.
🔶 USAGE
This sequence looks for pressure on one side of a swing zone.
The market tried to break out of the zone twice but failed. This led to a pullback into the zone after each attempt. Once a reversal inside the zone is identified, the sequence is complete. It is expected that the market will move from the final reversal within the zone to the final breakout attempt outside the zone.
The sequence of price action is as follows:
Point 1: Breakout attempt out of the swing zone
Point 2: Pullback into the zone
Point 3: Breakout attempt out of Point 1
Point 4: Pullback into the zone, tapping into Point 2 liquidity
Point 5: Reversal structure with Point 4 in the form of a double top or double bottom
This sequence assumes traders will be caught off-guard when they try to capitalize on the initial breakout at Point 1, which is likely to result in a loss. If the breakout at Point 3 fails, all traders will be caught out and switch positions.
If there is enough pressure in the swing zone to cause a reversal at Point 5, the trapped traders could be the start of the next breakout attempt.
🔹 Sequence Detection
Traders can define sequence behavior and adjust detection with three parameters from the Settings panel.
Disabling Points 4 and 5 will detect the most uncompleted sequences.
🔹 Showing/Hiding Elements
Traders can change the look of sequences by showing or hiding their parts using the Style settings.
🔶 SETTINGS
Swing Length: Number of candles to confirm a swing high or swing low. A higher number detects larger swings.
Internal Length: Number of candles to confirm a internal high or internal low. A lower number detects smaller swings. It must be the same size or smaller than the swing length.
🔹 Detection
Point 4 Beyond Point 2: It only detects sequences where Point 4 is beyond Point 2.
Show Point 5: Enable/disable Point 5 detection.
Require Equal H/L at Point 5: Enable/Disable double top/bottom detection at Point 5 within a given threshold. A bigger value detects more sequences.
🔹 Style
Show Sequence Path: Enable/disable a line between sequence points.
Show Boxes: Enable/disable colored boxes for each sequence.
Show Lines: Enable/disable horizontal lines from each point of the sequence.
Default Color: Define the color or enable/disable auto color.

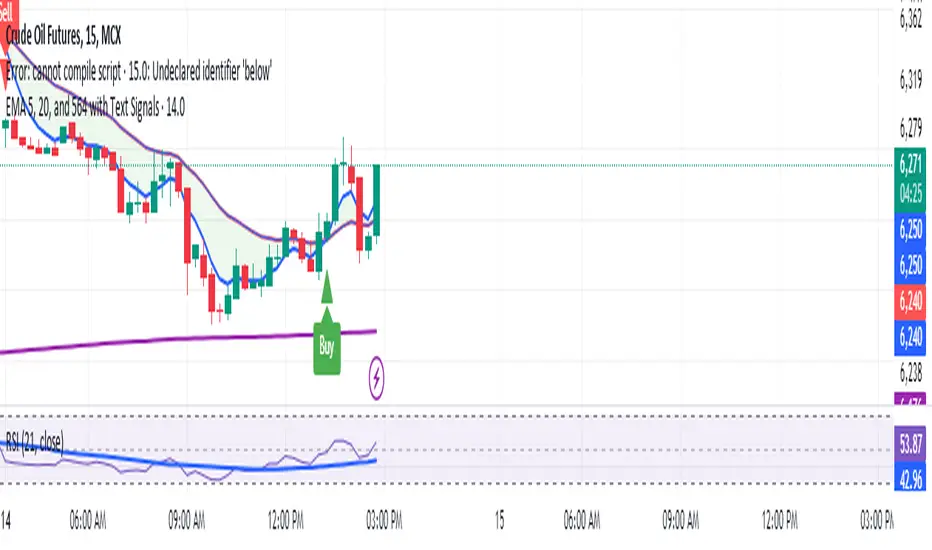
Manoj Personal EMA 5-203 EMA Trading Strategy Script Overview:
EMAs Used:
5 EMA: Short-term moving average.
20 EMA: Medium-term moving average.
564 EMA: Long-term moving average to identify overall trend direction.
Entry Signals:
Strong Buy: Triggered when:
Price is above the 564 EMA (uptrend).
The 5 EMA crosses above the 20 EMA (bullish crossover).
The current candle is green (close > open).
Strong Sell: Triggered when:
Price is below the 564 EMA (downtrend).
The 5 EMA crosses below the 20 EMA (bearish crossover).
The current candle is red (close < open).
Exit Signal:
Position is closed when the price touches back to the 564 EMA (either side, up or down):
A "Close Position" label is shown in green for long trades.
A "Close Position" label is shown in red for short trades.
Risk Management:
Stop-Loss: Placed at the last swing low (for longs) or last swing high (for shorts), calculated over the last 10 bars.
Take-Profit: A 1:3 risk/reward ratio is used, where the potential reward is three times the risk.
Alerts:
Alerts are triggered for buy and sell signals.
Alerts are also triggered when the exit condition (price touching the 564 EMA) is met.
This script is designed to work on timeframes of 15 minutes or higher but can also be used for 5-minute scalping. It plots the EMAs on the chart, highlights buy/sell opportunities, shows stop-loss and take-profit levels, and generates alerts for key signals.
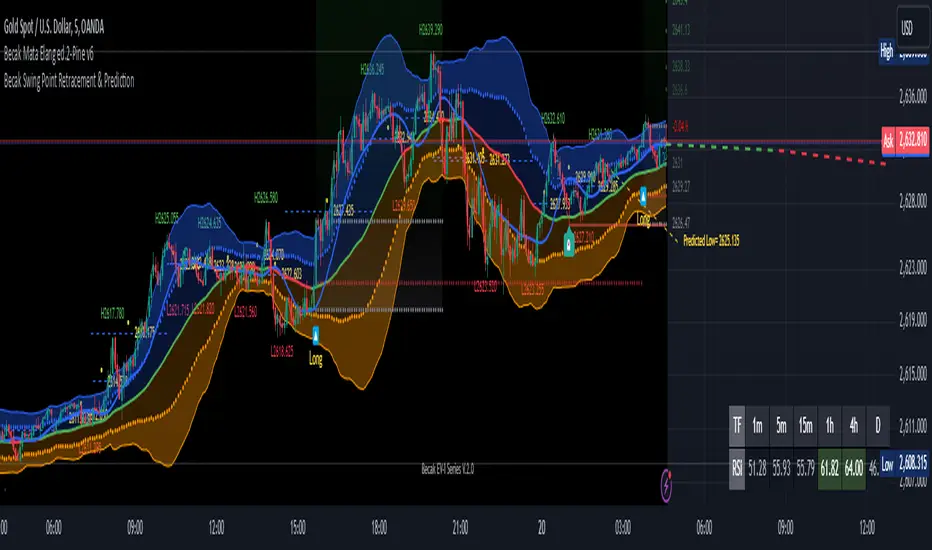
[Becak] - Swing Point Retracement & Prediction" - Swing Point Retracement & Prediction," is designed to identify swing points in price action, calculate retracement levels, and predict potential future price levels. It's a technical analysis tool that can help traders identify potential support and resistance levels, as well as possible reversal points.
HOW IT WORK
Swing Point Detection:
The indicator uses the ta.pivothigh() and ta.pivotlow() functions to identify swing highs and lows within a specified lookback period.
Retracement Levels:
When a new swing point is detected, the indicator calculates a retracement level based on the user-defined retracement percentage. It draws a dashed blue line at the retracement level, along with a yellow circle and a label showing the price.
Swing Point Labeling:
Swing highs are marked with a green "H" label and the price, and Swing lows are marked with a red "L" label and the price.
Price Prediction:
Based on the most recent swing point, the indicator attempts to predict the next potential high or low. It draws a purple dashed line extending into the future, indicating the predicted price level.
HOW TO USE THIS INDICATOR:
adjust the input parameters:
"Swing Point Lookback": Determines how far back the indicator looks to identify swing points. A larger value will result in fewer, more significant swing points.
"Retracement %": Sets the percentage for calculating retracement levels. 50% is a common Fibonacci retracement level, but you can adjust this based on your trading strategy.
"Prediction Length": Determines how far into the future the prediction line extends.
Interpret the results:
Use the swing point labels (H and L) to quickly identify recent highs and lows. The blue dashed lines and yellow circles indicate potential support or resistance levels based on the retracement percentage. The purple dashed line shows a potential future price target. This can be used to set profit targets or identify potential reversal zones.
Combine with other analysis:
This indicator works best when combined with other forms of analysis, such as trend lines, moving averages, or candlestick patterns.
Use the retracement levels and predictions as potential entry or exit points, but always confirm with other indicators or price action signals.
Price Action Volumetric Breaker Blocks [UAlgo]The Price Action Volumetric Breaker Blocks indicator is designed to identify and visualize significant price levels in the market. It combines concepts of price action, volume analysis, and market structure to provide traders with a comprehensive view of potential support and resistance areas. This indicator identifies "breaker blocks," which are price zones where the market has shown significant interest in the past.
These blocks are created based on swing highs and lows, and are further analyzed using volume data to determine their strength. The indicator also tracks market structure shifts, providing additional context to price movements.
By visualizing these key levels and market structure changes, traders can gain insights into potential areas of price reversal or continuation, helping them make more informed trading decisions.
🔶 Key Features
Dynamic Breaker Block Identification: The indicator automatically detects and draws breaker blocks based on swing highs and lows. These blocks represent areas of potential support and resistance.
Volume-Weighted Strength Analysis: Each breaker block is analyzed using volume data to determine its bullish and bearish strength. This is visually represented by the proportion of green (bullish) and red (bearish) coloring within each block.
Market Structure Break (MSB) and Break of Structure (BOS): The indicator identifies and labels Market Structure Breaks (MSB) and Break of Structure (BOS) events, providing context to larger market trends.
Customizable Settings:
- Adjustable swing length for identifying pivot points
- Option to show a specific number of recent breaker blocks
- Choice between wick or close price for violation checks
- Toggle to hide overlapping blocks for cleaner analysis
Violation Detection: Automatically detects when a breaker block has been violated (broken through), either by wick or close price, depending on user settings.
Overlap Control: Provides an option to hide overlapping order blocks, ensuring that the chart remains clean and easy to read when multiple blocks are detected in close proximity.
🔶 Interpreting Indicator
Breaker Blocks:
Breaker blocks are key areas where the price moves through and invalidates a previously identified order block. The indicator detects a breaker block when the price violates an order block by exceeding its high or low (depending on whether it's a bullish or bearish block). This violation is determined by either the wick or the close of a candle, depending on the user's selection in the "Violation Check" setting. When a breaker block is detected, the indicator removes the violated order block from the chart, signaling that the zone is no longer relevant for future price action.
Bullish Breaker Block: This occurs when a bearish order block (red) is violated by the price closing above the block’s top boundary or when the wick surpasses this level. It signals that a prior bearish structure has been invalidated, and the market may shift to a bullish trend.
Bearish Breaker Block: This occurs when a bullish order block (teal) is violated by the price closing below the block’s bottom boundary or when the wick drops below it. It suggests that a previous bullish structure has been broken, indicating potential bearish momentum.
Market Structure Labels:
"MSB" (Market Structure Break) labels indicate a potential change in trend direction.
"BOS" (Break of Structure) labels confirm the continuation of the current trend after breaking a significant level.
Block Strength:
A block with more green indicates stronger bullish interest.
A block with more red indicates stronger bearish interest.
The relative sizes of the green and red portions show the balance of power between buyers and sellers at that level.
🔶 Disclaimer
Use with Caution: This indicator is provided for educational and informational purposes only and should not be considered as financial advice. Users should exercise caution and perform their own analysis before making trading decisions based on the indicator's signals.
Not Financial Advice: The information provided by this indicator does not constitute financial advice, and the creator (UAlgo) shall not be held responsible for any trading losses incurred as a result of using this indicator.
Backtesting Recommended: Traders are encouraged to backtest the indicator thoroughly on historical data before using it in live trading to assess its performance and suitability for their trading strategies.
Risk Management: Trading involves inherent risks, and users should implement proper risk management strategies, including but not limited to stop-loss orders and position sizing, to mitigate potential losses.
No Guarantees: The accuracy and reliability of the indicator's signals cannot be guaranteed, as they are based on historical price data and past performance may not be indicative of future results.

Birdies [LuxAlgo]The Birdies indicator uses a unique technique to provide support/resistance curves based on a circle connecting the last swing high/low.
A specific, customizable part of this circle acts as a curve of interest, which can trigger visual breakout signals.
🔶 USAGE
The script projects a bird-like pattern when a valid Swing point is found. Multiple customization options are included.
🔹 Trend & Support/Resistance Tool
The color fill patterns and the wing boundaries can give insights into the current trend direction as well as serve as potential support/resistance areas.
In the example above, "Birdies" coincide with pullback and support/resistance zones.
🔹 Swing Length & Buffer
Besides the "Swing Length", with higher values returning longer-term Swing Levels, the script's behavior can be fine-tuned with filters ("Settings" - "Validation").
🔹 Validation
To minimize clutter, three filters are included:
Minimum X-Distance: The minimum amount of bars between subsequent Swings
Minimum Y-Distance: The minimum amount of bars between subsequent Swings
Buffer (Multiple of ATR)
The "Minimum X/Y-Distance" creates a zone where a new Swing is considered invalid. Only when the Swing is out of the zone, can it be considered valid.
In other words, in the example above, a Swing High can only be valid when enough bars/time have passed, and the difference between the last Swing and the previous is more than the ATR multiplied by the "Minimum Y-Distance" factor.
The "Buffer" creates a line above/below the "Birdy", derived from the measured ATR at the conception of the "Birdy" multiplied with a factor ("Buffer").
When the closing price crosses the "Birdy", it must also surpass this buffer line to produce a valid signal, lowering the risk of clutter as a result.
🔶 DETAILS
Birdies are derived from a circle that connects two Swing points. The left-wing curve originates from the most recent "Swing point" to the last value on the circle before crossing its midline. The mirror image of the left wing creates the right wing.
Enabling "Origine" will draw a line from the last Swing to the first.
🔹 Style
The publication includes a style setting with four options.
The first, "Birdy," shows a bird-like shape derived from a circle connecting the last Swing High and Swing Low.
The second option holds everything from the first option but connects both wingtips, providing potential horizontal levels of interest.
When setting "Birdy" to "None", the visual breakout signals will not defer from previous settings, but the focus is shifted towards the fill color, which can help detect potential trend shift.
A fourth setting, "Left Wing", will only show the left part of the "Birdy" pattern, removing the right part from the equation. This will change the visual breakout signals, providing alternative signals.
🔶 SETTINGS
Swing Length: The period used for swing detection, with higher values returning longer-term Swing Levels.
🔹 Validation
Minimum X-Distance: The minimum amount of bars between subsequent Swings
Minimum Y-Distance: The minimum amount of bars between subsequent Swings
Buffer (Multiple of ATR)
🔹 Style
Bullish Patterns: Enable / color
Bearish Patterns: Enable / color
Buffer Zone: Show / Color
Color Fill: Show color fill between two Birdies (if available)
Origine: Show the line between both Swing Points
🔹 Calculation
Calculated Bars: Allows the usage of fewer bars for performance/speed improvement
